
Your graph. Your interface.
Build interactive dashboards with Free, Flow, and Scale to fit layouts, plots, tables of controls and indicators, notes, and visualizations.
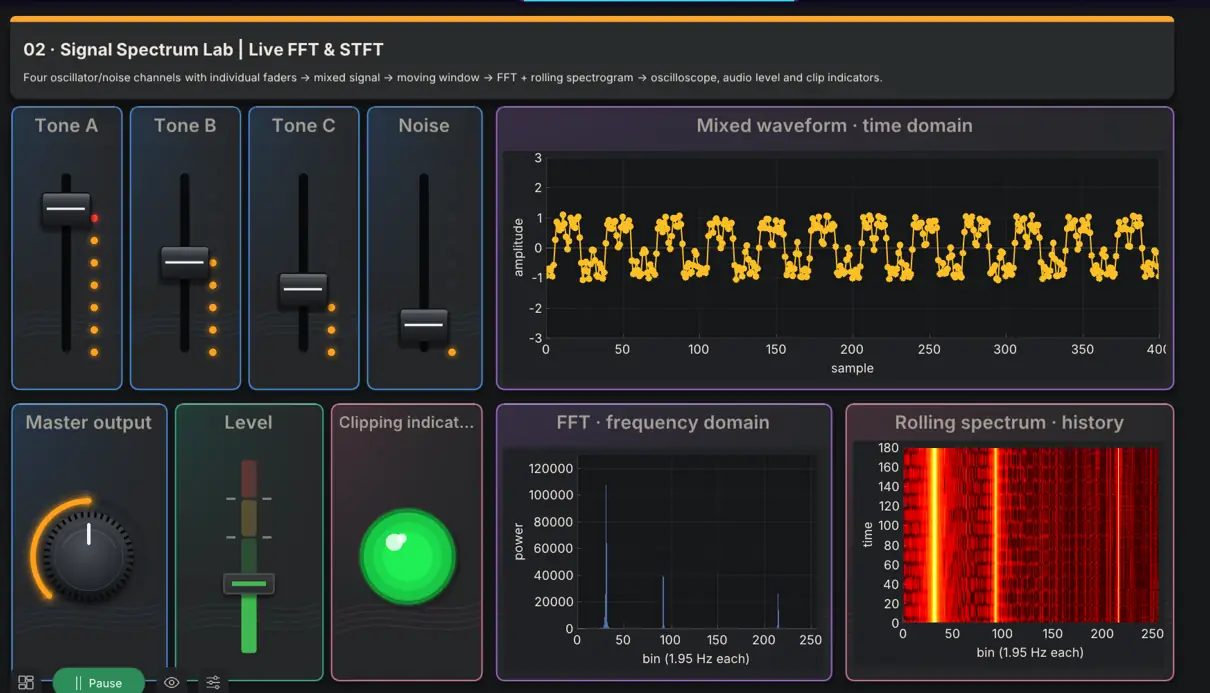
Three ways to arrange your work
Free preserves your chosen card positions and sizes. Flow arranges cards in rows that scroll vertically or columns that scroll horizontally. Scale to fit adapts the free layout to the visible area. Switching modes preserves the free arrangement.
Tables that work as control panels
A matrix table can show each value as a number, a slider, a knob, a switch, a push button, or a light. Choose the look for the whole table, a column, a row, a single cell, or a range of values, and decide which cells people can change and which only show results. Presets set up a mixer, a switch panel, a status board, or gauges in one click.
Controls and indicators with a purpose
Numeric controls offer sliders, knobs, and switches with selectable styles; value indicators show meters and lights. Zone styles support configurable green, yellow, and red ranges. These controls are part of the native product; this website does not run a graph.
Plots that fit the dashboard
Fix the range of each axis or let it follow the data, and hide axes, title, legend, or frame for a minimal look that keeps the signal readable on small cards.
Notes and comments where the work is
Write formatted notes on the node canvas and on the dashboard, attach them to nodes, and discuss the work in comment threads pinned where they apply.
Widgets follow node support
A node can appear in a dashboard only when its UI implementation supports it. Plots, image views, numeric controls, value indicators, and matrix tables are among them.