
Computational workflows. Built visually.
Explore LazyAnalysis: executable computational graphs, lazy evaluation, caching, and interactive dashboards.
The graph is the program
Connect computational nodes through typed input and output pins. The resulting graph describes the computation itself: a visible structure you can inspect, change, and reuse.
An interface for your computation
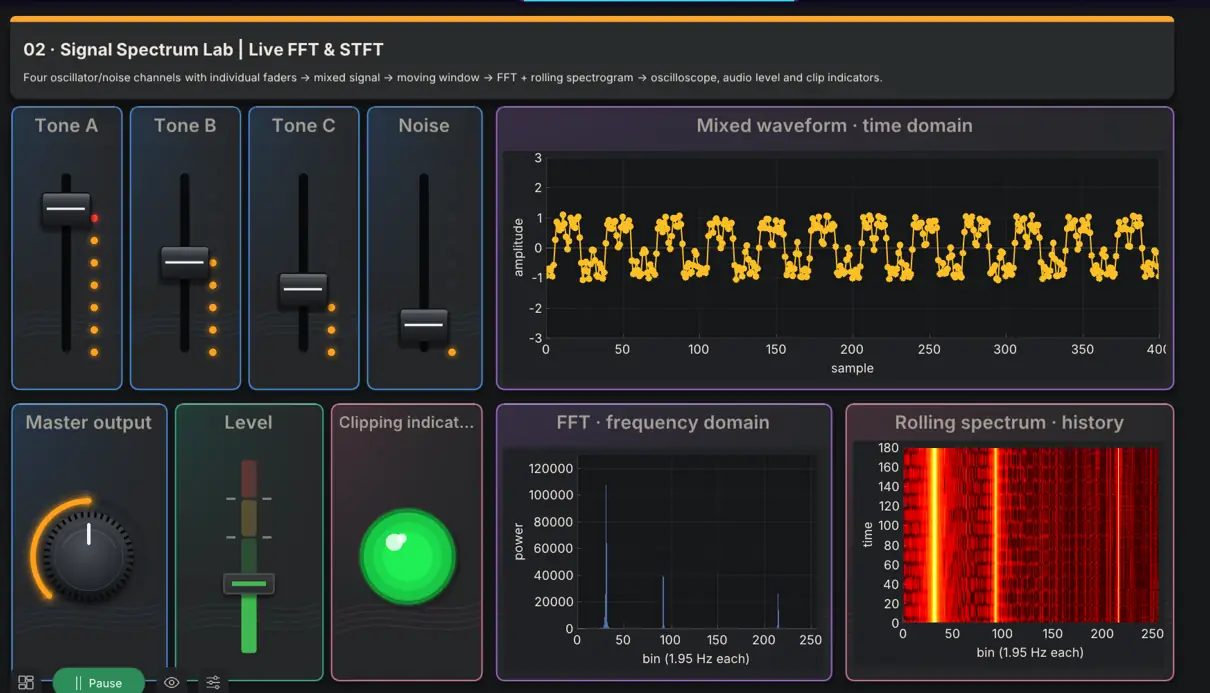
Where supported, nodes also provide dashboard widgets. Combine plots, visualizations, and controls to turn a workflow into an interactive application.
Native foundations. A browser-facing future.
The existing C++ application includes headless runtime and remote browser UI code. A public hosted experience is planned; it is not available here today.
Execution with intent.
How lazy evaluation, caching, and parallel computation fit together in LazyAnalysis.
↗INTERACTIVE DASHBOARDSYour graph. Your interface.
Build interactive dashboards with Free, Flow, and Scale to fit layouts, plots, tables of controls and indicators, notes, and visualizations.
↗AI & THE ROAD AHEADYour idea. Your AI builds it.
Connect your AI assistant to LazyAnalysis through MCP and turn a description into a node graph and its dashboard, checked before you open it.
↗